We have plenty of snow outside. We just can't play with it, because it's just been way too cold to go outside. Fortunately, though cooped up inside, they're hangin' with me fairly well. It helps that we take lots of breaks. Today we took one that they'd love to repeat often. I didn't invent the idea, but I did take it up a notch by adding a simple math component.
I split the group in half and sent them to opposite sides of the room with their paper snowballs. At my signal they let them fly. The winning team is the one with the fewest number of snowballs on their side when time is up, so they did their best to get those snowballs on to the opposite side of the room. At my signal, they stopped throwing and two chosen collectors gathered up each team's snowballs. Here's the best part. Instead of simply counting them up, we created a visual. It was easy, meaningful, and so quick, we grabbed our snowballs and played one more time.


For many years it's been a tradition of mine to experiment with graphs and data on a consistent basis throughout the year. However, last week I was challenged at a measurement and data workshop to take graphing to a whole new level, a level at which students really show an understanding of graphing by making their own from scratch. How do I really know my mathematicians understand graphs if all they ever do is add their bit of data to a graph I've already created? I can see how limited their understanding really must be.
In a nutshell, here's the scenario the presenter shared in the workshop. She asked a group of second graders what kind of face she should carve her pumpkin. They brainstormed four options. Then each one drew the face they preferred on a small pumpkin cut-out and placed it on the board under the option they chose. (There was purposely no organization to how the pumpkins were placed, except that they were grouped under the name.) The teacher then said she needed a way to share the results with others but obviously couldn't take the board with her. She gave each child a blank piece of paper and asked them how they would organize the information differently than she did. After some work time, she gathered their ideas and shared a few with the document camera that showed the best qualities of a proper graph. She asked the types of questions that would help the kids communicate what they noticed and what made those particular examples easy to read, making sure to really highlight what she would want to see in a graph. Then she gave them another piece of blank paper and asked them to try again using the ideas they had just talked about.
I instantly knew I needed to make this part of my classroom practice. For my first try at it, I meshed it with a Halloween graph activity I do every year. I asked my kids to bring in the wrapper of their favorite piece of Halloween candy. Since I rarely get 100% participation on this graph, I knew it would be a good one to start with because there would be fewer bits of data for them to manipulate. (The second graders had over 20 items on their graph, along with four columns. I knew we needed to start small and gradually work our way to more columns and more data.)
First we sorted the candy on the board into chocolatey and sugary groups. The kids who brought wrappers were in charge of taping them to the board. You'll notice in the picture that they taped them in a very organized fashion. I did not direct them to do so. In fact, I kind of wish they had been more disorganized about it. :)
Then I said that if we wanted to keep this information and even share it with others, we'd need a way to organize and save it. I gave each one a piece of blank paper and challenged them to organize the information differently than I did. I also said they could work by themselves or work with a buddy.
After some work time, I gathered their sheets and shared a few under the document camera.
My most frequent questions were:
What do you notice?
Why do you think they did ________?
Then everyone turned their papers over, and I asked them to use Claire's or Cooper's strategies to organize the information again.
Out of the second attempt, came something else to quickly highlight, since Alex numbered his graph.
I see this as just the beginning of a growing and more comprehensive understanding of graphs in my room. The second grade teachers are going to be thrilled when my little graph-makers arrive next year.

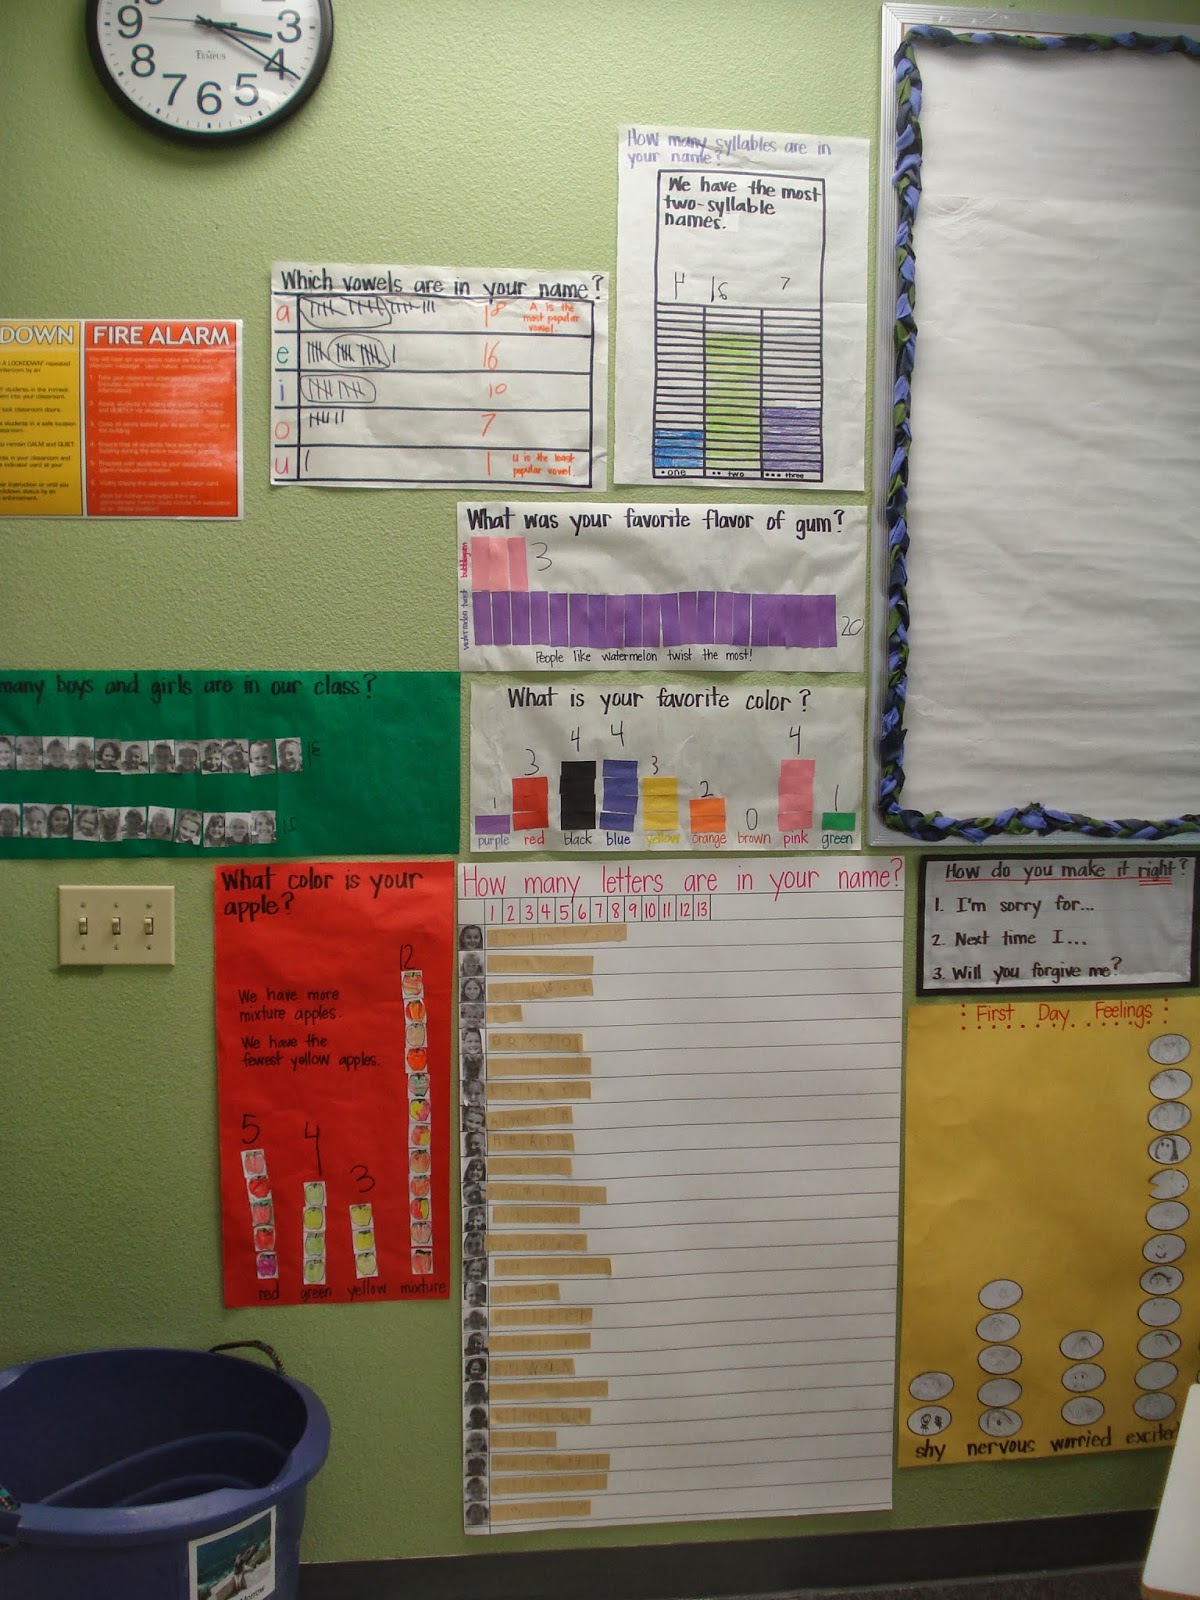
I don't have a data or graph unit per se. Several years ago, Math Their Way taught me to simply make it part of my weekly ritual. In other words, my goal is to make a graph a week. Honestly, I've had a hard time keeping that up throughout the years, but one of my goals this year is to do a better job of that. My graphs aren't fancy. They aren't cutesy. I just don't get much joy in spending a lot of my time preparing them. They are relevant though. They fit into whatever we're doing that week and go up on the wall as we make them. Here's a view of what we've accomplished so far.
When my wall space fills up, I replace older ones as newer ones are made. Then I keep them in a safe place so that at the end of the year they can go home as souvenirs. Graphing our year basically means that learning about and interpreting data from graphs seems like a piece of cake.